The Retention Directive™ Case Study
Breaking the Acquisition Trap: How a $4.2M HVAC Company Turned Retention Into Its Primary Growth Engine

Note: This case study is a composite scenario built from verified industry benchmarks, published HVAC market data, and the Retention Directive™ framework. The company name and specific details are illustrative. The data inputs—retention rates, plan penetration benchmarks, pull-through multipliers, and acquisition cost ratios—are drawn directly from industry research. This scenario represents the realistic trajectory of an HVAC company that shifts from acquisition-first to retention-led growth over 12 months.
+$587K
New Revenue in 12 Months
+40%
Retention Rate Improvement
+332%
MRR Growth
-12%
Marketing
Spend
Reduction
The Trap: Where They Started
Company Profile: “Midwest Mechanical”
A composite HVAC and plumbing services company representative of the $1M–$10M operators the Retention Directive™ is built for.
The Problem in Their Own Words
“We hit our lead targets every quarter. The campaigns work. But nothing sticks. Every spring, we start from scratch—same Google Ads, same mailers, same scramble. We’re growing, technically, but it doesn’t feel like it. Revenue is flat because we’re replacing customers as fast as we’re acquiring them. The CEO asks me why we’re spending more every year and growing slower. I don’t have a good answer.”
The Diagnosis
Midwest Mechanical was deep in the Acquisition Trap. With only 12% plan penetration, 88% of their residential customer base had zero structural reason to come back. They were spending $357,000 a year on acquisition, generating roughly 1,900 new customers annually, while silently losing 1,736 customers out the back door. Net customer growth: 164 per year. That’s a $357,000 investment producing a net gain of less than 6%. The VP of Marketing wasn’t bad at her job. She was excellent at acquisition. The problem was that acquisition was the only lever anyone had given her.
Metric | Starting Position |
|---|---|
Annual Revenue | $4.2 million |
Service Area | Mid-sized metro + suburbs (120-mile radius) |
Residential Customers | 2,800 active in CRM |
Commercial Accounts | 45 (property managers, restaurants, office buildings) |
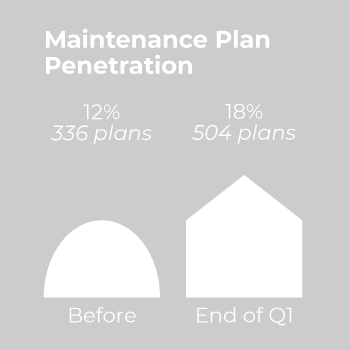
Maintenance Plan Penetration | 12% (336 customers on a residential plan) |
Customer Retention Rate | 38% year-over-year |
Annual Customer Loss | ~1,736 customers lost annually (62% churn) |
Average Residential Agreement Value | $289/year |
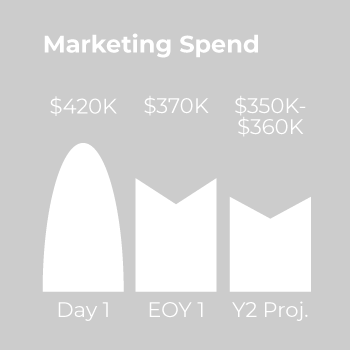
Total Marketing Budget | $420,000/year (10% of revenue) |
Budget Allocation | 85% acquisition ($357K) / 15% retention ($63K) |
Primary Lead Sources | Google LSA, Angi, direct mail, truck wraps, radio |
Average Cost Per Acquired Customer | $185 (blended across all channels) |
Team | VP of Marketing + 2 coordinators; 1 external agency for PPC |
The Shift: The Retention Directive™ Engagement
Midwest Mechanical engaged the Retention Directive™ for a 12-month strategic partnership. The first step was building a Loyalty Growth Roadmap™ focused on three immediate priorities:
1
Stop the bleed
Reduce customer churn from 62% to under 35% within six months by implementing post-service follow-up sequences and proactive maintenance plan conversion campaigns.
2
Activate the dormant database
Re-engage the 1,200+ customers in their CRM who hadn’t booked in 12–24 months—people who already knew and trusted their work.
3
Shift budget gradually
Over four quarters, move from 85/15 acquisition-to-retention split to 60/40—reinvesting acquisition savings into retention systems that compound.
No new software. No new hires. Same team. Same agency. Different strategy.
The Transformation: Quarter by Quarter
Quarter 1: Activate the Database (Months 1–3)
Actions Taken
Post-service nurture sequence launched.
Same-day text check-in, Day 3 maintenance tip email, Day 7 review request, Day 30 plan offer. Applied to all residential service calls going forward.
Dormant customer reactivation campaign.
Email + postcard + text sequence targeting 1,247 customers with no booking in 12–24 months. Message: “Spring is coming—your system hasn’t been checked in over a year. Priority scheduling available for returning customers.”
Commercial account outreach.
VP of Marketing personally called the top 20 commercial accounts for a 15-minute check-in. No sales pitch—just relationship building and proactive recommendations.
Q1 Results


Revenue Impact
+$48,000
new annualized MRR
289
reactivated customers generated
+$52,000
in immediate service bookings
Cost to Execute
+$8,200
email platform, postcard printing/
mailing, staff time for commercial calls
ROI
12:1
Quarter 2: Build the Renewal Engine (Months 4–6)
Actions Taken
90-day pre-renewal sequence implemented.
Automated email and text touchpoints beginning 90 days before each maintenance agreement anniversary. Three touchpoints: 90-day reminder, 60-day value recap, 30-day urgency message with a small loyalty bonus for early renewal.
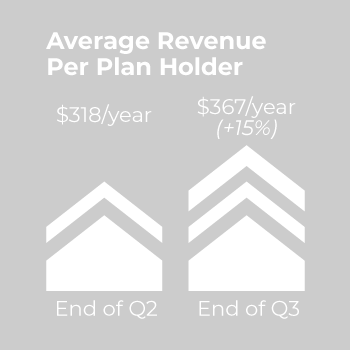
Tiered plan options introduced.
Created a three-tier plan structure (Basic $189, Standard $289, Premium $449) to give existing customers an upgrade path rather than just a binary renew/cancel decision.
Budget reallocation begins.
Reduced Google LSA spend by 15% ($3,500/mo). Reinvested into retention tools and a part-time CRM coordinator role.
Referral program launched.
Simple structure: existing plan members who refer a new plan sign-up receive a $50 service credit. No complex points systems.
Q2 Results


Revenue Impact
+65% ($20,000)
MRR growth
+$12,544
annualized value from tier upgrades
+$12,400
saving vs. paid channels by referral program generating 67 new customers at $0 acquisition cost
$143,000
Total Q2 retention-driven revenue
Key Insight
The 74% renewal rate meant that for the first time, the VP of Marketing could forecast next quarter’s revenue with confidence.
The CEO noticed.
Quarter 3: Expand Wallet Share (Months 7–9)
Actions Taken
Cross-sell campaign: plumbing to HVAC customers.
Targeted plan holders with a bundled offer: add plumbing inspection to your existing HVAC plan for $99/year. Positioned as convenience and cost savings vs. separate providers.
Commercial quarterly business reviews formalized.
All 45 commercial accounts now receive structured QBRs—system health report, efficiency recommendations, upcoming maintenance schedule, and a proactive upsell discussion (indoor air quality, duct cleaning, water heater replacement programs).
Seasonal pre-booking campaign.
All plan holders received an early-bird fall booking offer 75 days before the heating season. Goal: lock in 60% of fall appointments before the season started.
Second dormant reactivation wave.
Targeted the remaining dormant list (958 customers) who didn’t respond to Q1 outreach, with a revised message and a time-limited offer.
Q3 Results


The second reactivation wave brought back 112 additional customers.
Revenue Impact
$349,000
annualized MRR / 259% increase from $97.2K baseline
+$20,800
cross-sell revenue
+$46,000
commercial account growth
$197,000
Total Q3 retention-driven revenue
Key Insight
With 64% of the fall schedule pre-booked through plan holders, the team spent significantly less on fall acquisition campaigns. September ad spend dropped 40% year over year, while bookings increased 18%.
The flywheel was turning.
Quarter 4: Present Board-Ready Results (Months 10–12)
Actions Taken
Loyalty Growth Roadmap refined for Year 2.
Retention strategy codified into a repeatable quarterly playbook. Renewal sequences, reactivation campaigns, QBRs, and cross-sell programs all running as ongoing systems—not one-time campaigns.
Boardroom Growth Report prepared.
The VP of Marketing worked with the Retention Directive to build a quarterly executive presentation showing retention’s impact in the language the CEO and CFO care about: MRR, LTV, churn rate, net revenue retention, and acquisition cost efficiency.
Budget formally restructured.
Marketing budget for Year 2 approved at a 60/40 acquisition-to-retention split (down from 85/15), with total marketing spend reduced by 12% while projected revenue increased.
Q4 Results


+$587K
New Revenue in 12 Months
38%→
78%
Retention Rate Improvement
+332%
MRR Growth
-12%
Marketing Spend Reduction
The Full Financial Picture
Revenue Source | 12-Month Value |
|---|---|
New MRR from plan growth (336 _ 1,148 plans) | $324,000 |
Tier upgrades and cross-sell revenue | $63,000 |
Dormant customer reactivation (401 customers) | $89,000 |
Commercial account expansion | $73,000 |
Referral-generated customers (198 at $0 CAC) | $38,000 |
Total New Retention-Driven Revenue | $587,000 |
Savings Source | 12-Month Value |
|---|---|
Reduced acquisition spend (from $357K to $222K) | $135,000 saved |
Referral customers replacing paid leads (198 _ $185 CAC) | $36,600 saved |
Reduced seasonal campaign urgency (fall ads _40%) | $18,000 saved |
Total Acquisition Cost Savings | $189,600 saved |
Net Impact
Total 12-month financial impact: +$776,600
($587,000 in new revenue + $189,600 in acquisition savings).
Retention Directive investment as a percentage of impact: less than 8%.
What the CEO Said at the Q4 Board Meeting
“Our marketing department used to hand me lead reports. Now they hand me growth forecasts. For the first time, I can see exactly where next quarter’s revenue is coming from before we spend a dollar on ads. That’s the difference between a marketing team and a growth engine.”
The VP of Marketing was promoted to CMO at the start of Year 2.
The Compounding Effect: Year 2 and Beyond
The most powerful aspect of retention-led growth is that it compounds. Year 1 built the foundation. Year 2 and beyond is where the flywheel accelerates.


3-year projected cumulative impact
Based on the compounding trajectory established in Year 1, Midwest Mechanical’s retention-led strategy is projected to generate $1.5M–$1.8M in cumulative new revenue over three years, while reducing total marketing spend by approximately $150,000 over the same period.
That’s the difference between a marketing department that resets every quarter and a growth engine that compounds every quarter.
Your Customers Are Already There. The Revenue Is Waiting.
Midwest Mechanical was losing 62% of its customers every year and didn't know it.
Once they saw the math, they couldn't unsee it, and neither will you.
The question isn't whether your company has a retention gap. It's how big the gap is and how much revenue is walking out the back door while your budget chases the next lead.
Find out in the next three minutes.
See exactly what churn is costing your business — and what a 20-point retention improvement would save.
12 questions. Three minutes. The Acquisition Trap Assessment provides a clear picture of how deep the trap runs and offers personalized recommendations.